Firmographics
In short
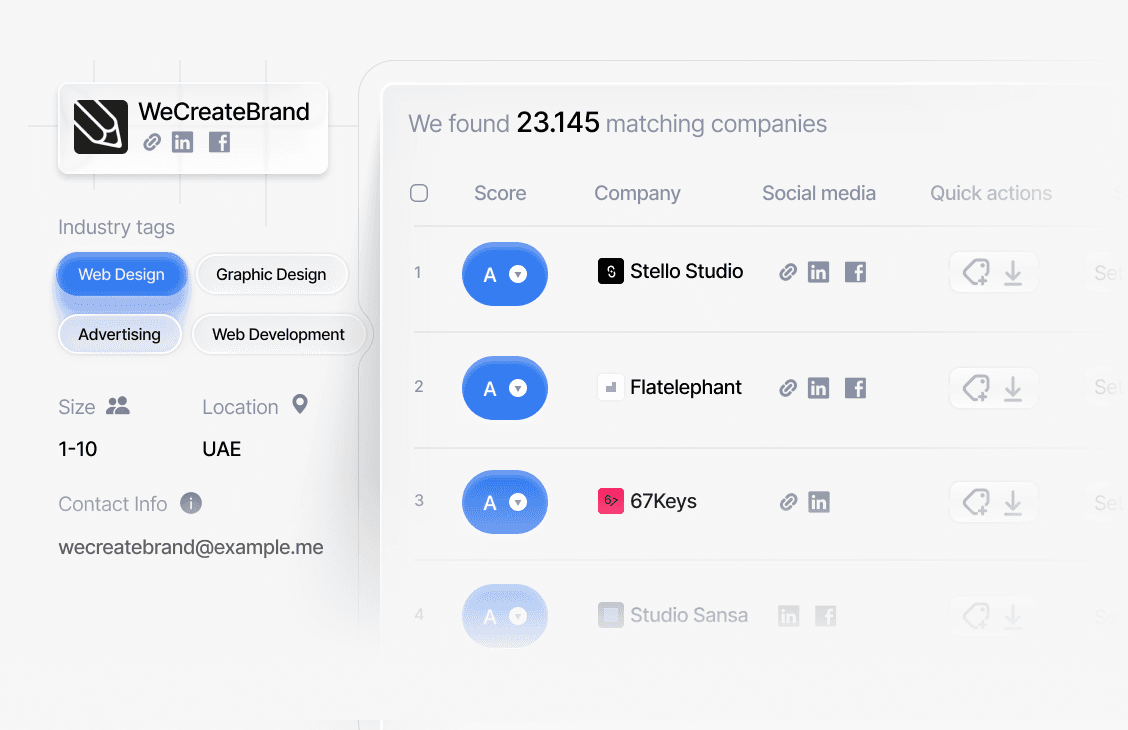
Firmographics are the characteristics used to classify and compare organizations: industry, size, revenue, location, growth stage, and similar traits. They do for companies what demographics do for individual consumers.
The word usually refers to the practice or lens of grouping companies, while "firmographic data" refers to the specific values stored in a system. In day-to-day GTM talk the two are used almost interchangeably.
What firmographics answer
Firmographics answer the question "what kind of company is this?" They do not answer "is this company in the market right now?" That needs intent or trigger data.
Firmographic segmentation in practice
Step 1: choose the traits that matter
Look at won deals and find which traits recur. Many teams find that size band and industry explain more than revenue or location.
Step 2: define tiers
Say a team defines Tier 1 as 500-5,000 employees in three target industries, Tier 2 as 100-499 employees in the same industries, and everything else as Tier 3. Each tier gets a different play: personal outreach, light automation, or nurture only.
Step 3: apply across systems
The same definitions should drive CRM fields, ad audiences, and sales territories so reports line up.
Strengths and limits
- Strength: Easy to filter, stable over months, and available for nearly every company.
- Limit: Says nothing about pain, budget, or timing.
- Limit: Revenue and headcount for private firms are often estimates.
Pairing firmographics with other signals
- Technographics: Which tools the company uses.
- Intent: Whether people at the company are researching the topic.
- Triggers: Funding, leadership changes, or hiring surges that open a buying window.
Common mistakes
- Over-slicing: Too many size and industry bands create segments too small to act on.
- Inconsistent definitions: Marketing and sales using different size bands makes handoffs messy.
Firmographics FAQs
What are firmographics in B2B marketing?
Firmographics are characteristics of companies, such as industry, employee count, revenue, location, and growth stage. B2B marketers use them to group accounts into segments, target campaigns, and decide which companies fit their ideal customer profile.
How do firmographics differ from demographics?
Demographics describe individual people, such as age, role, or seniority. Firmographics describe organizations, such as size and industry. In B2B you typically select companies by firmographics, then contacts by role and seniority.
Are firmographics enough to qualify an account?
Usually not. Firmographics show fit but not timing or need. Most teams combine them with technographic data, intent signals, and trigger events to decide which fitting accounts are worth contacting now.
How do you use firmographics for segmentation?
Pick the traits that separate your best customers from the rest, group accounts into tiers by those traits, and assign a different sales or marketing play to each tier. Apply the same definitions in your CRM, ads, and territories.